
Brazil’s public and private infrastructure sector is investing in processes improvement and kaizen implementation. Included in this investment is a study of the of ratio of value added vs. non-value added activities on site. The main goal of this initial diagnostic step is to understand the processes involved to provide a basis for future improvements. The study presented in this blog post involves five infrastructure projects between 2013 and 2014 and demonstrates the use of production analysis tools that allow us to understand the level of waste present in the current state of the work. In the study we have considered the Transformation and Flows perspective of production where activities are categorized as value added activities, necessary non-value activities and unnecessary non-value added activities 1,2.
The study was conducted in partnership with Steinbock Consulting, a consultancy company specialized in implementing operational excellence methodology within heavy construction projects. The company used two techniques that can provide an initial diagnosis about value added in the shop floor activities: multi-momentum and chrono analysis.
Multi-momentum Analysis
Multi Moment Analysis (MMA) is the statistical technique for determining the proportion of time spent by workers in various defined categories of activity. Multi-momentum analysis consists in observing a shop floor by regularly taking a “photograph” of the observed activities. In each picture, we count the number of employees that were in production or developing activities. We categorize employees into three areas: 1) employees who are directly adding value, 2) employees who are performing supporting activities such as transport, displacement, quality inspection (necessary non-value activities), and 3) employees who are completely idle in the form of waiting, delays, and unnecessary work or rework (unnecessary non-value added activities).
Chrono Analysis
Chrono analysis consists of recording of a shop floor activity and subsequently quantify the time of each employee spent on each step of the activity. The amount of value added and non-value added activities are calculated based on the recorded videos.
Both observations, multi-momentum and chrono analysis, were made with periods of at least 60 minutes of activity, and in some cases, whole shifts including mobilization and demobilization were considered. In total, 16 different activities were observed. Figure 1 presents the amount of time in minutes found in the observation of each activity on those construction sites.
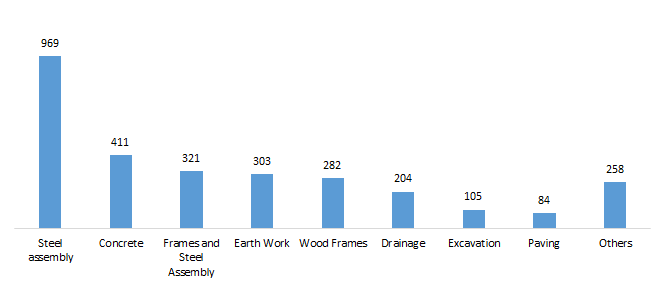
Figure 1: Time of analysis of each main activity on construction sites (time is presented in minutes)
Two of the five projects were conducted inside the city (intracity). Those two projects were analyzed by the same perspective and the results are presented as one. The second project is a highway, the third is a railway while the fourth is pipeline for the oil and gas industry. The last project is a residential building. In total there were around 49 hours of observations on those projects. In this period, 82% are documented with a multi-momentum analysis and 18% with a chrono analysis. Figure 2 presents the amount of analysis time that were made in each project.
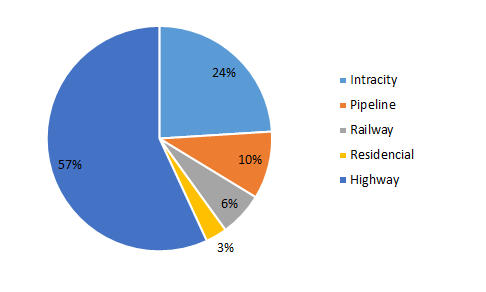
Figure 2: Analysis time-share of each Project
At this point it is important to state that only activities which transform resources into a product with higher value were classified as value added activities. In this way, works with large dimensions and high volume of displacement and transportation such as railways and highways result in less value added activities. Based on the observation, we found a lot of waste resulting from poor preparation of the shop floor. Idleness and high volumes of transportation and displacement were directly followed by poor preparation of routine work.
Figure 3 represents the added value level of each projects and figure 4 shows the performance of each project as well as the performance average of all projects. The green colored area shows the amount of time that the crews were adding value. The yellow area illustrates non-value added but necessary activities that cannot be eliminated in the process. Theses activities needs to be decreased. The red area represents waste.
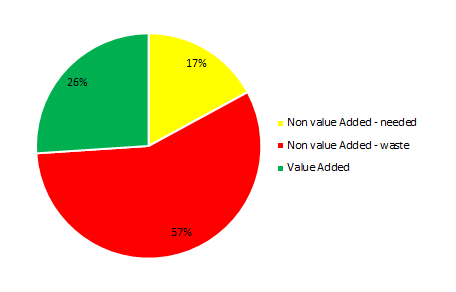
Figure 3: Value Added level of the five projects
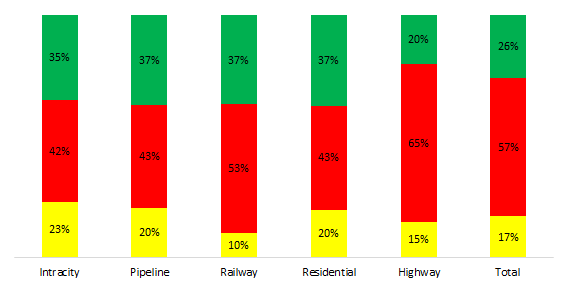
Figure 4: Value Added level in each of the five projects
As you can see in figures 3 and 4, there is a high percentage non-value added activities. With an average of 57%, the non-added value activities make up the largest portion of the project. By using chrono analysis and multi-momentum analysis it is clear that even companies with high technical capabilities and management team with extensive experience in infrastructure works are unaware of the level of waste that occurs in routine operations in the construction sites. By understanding the level of waste that exists we can promote a degree of urgency for the problem and convince management to allocate resources to take corrective actions. These analyses show that there is much to improve in the infrastructure sector. Given how much wasteful activities were seen in the observations, there are many low hanging fruits that can result in immediate gains in productivity by simply eliminating non-value-added activities.
References
1. Koskela, L. (1992). “Application of the New Production Philosophy to Construction”, Technical Report No. 72, CIFE, Stanford University, CA.
2. Howell, G.; Koskela, L.; Tech, Dr. (2000).“Reforming project management: the role of lean construction”.Proc. of the 8th Conference of the International Group for Lean Construction. Brighton, UK

