The Last Planner® System1 (LPS) is a production planning system designed to produce predictable work flow and rapid learning in programming, design, construction and commissioning of projects. LPS was developed by Glenn Ballard and Greg Howell and has five elements2 :
1. Master Scheduling: setting milestones and strategy; identification of long lead items
2. Phase "Pull" Planning: specify handoffs; identify operational conflicts
3. Make Work Ready Planning: look ahead planning to ensure that work is made ready for installation; re-planning as necessary
4. Weekly Work Planning: commitments to perform work in a certain manner and a certain sequence
5. Learning: measuring percent of plan complete (PPC), deep dive into reasons for failure, developing and implementing lessons learned.
WHAT IS PULL PLANNING?
According to Tsao et al.1, “Pull Planning is the second element of the LPS3 that establishes a project’s phase planning4. It is a collaborative planning process where project performers work together to design the process to deliver a milestone. The term 'Pull Planning' refers to the lean concept of 'pull' as a request from downstream as opposed to the top-down 'push' as applied in traditional practice.3 ”Pull Planning session includes the following steps5 :
(1) Structure definition
(2) Setting up the display board
(3) Development of planning from the end, working backwards
(4) Re-examination of the program
(5) Revision of constraints
(6) Compliance with agreements
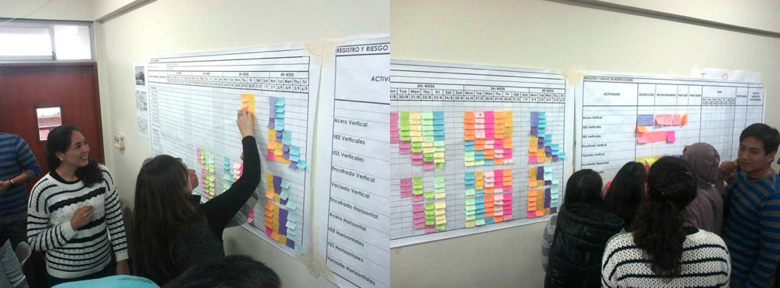
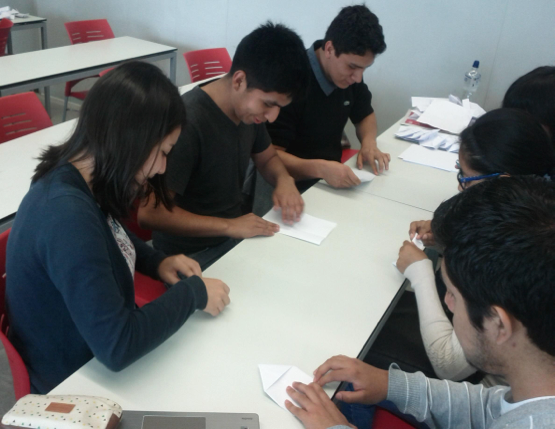
Figure 1: Pull Planning Session
It can include a preliminary origami simulation to better understand the Lean principles in a short time6. This method is applicable to academia and companies as well, and it starts with first understanding how pull works in an assembly process.
ORIGAMI GAMIFICATION: ONE PIECE FLOW
This game includes the origami House37. Six stations, six participants. Two rounds of six minutes each.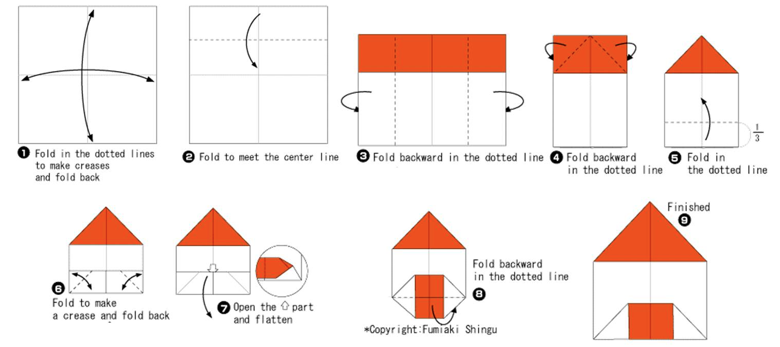
Figure 2: House3
Round 1:
Job positions are in the same sequence as work flows:
(1) Station 1: Performs process 1,
(2) Station 2: Performs processes 2 and 3,
(3) Station 3: Performs processes 4 and 5,
(4) Station 4: Performs processes 6 and 7,
(5) Station 5: Performs processes 8 and 9,
(6) Station 6: Responsible for examining (QC) to ensure product conformity.
Workers may talk about minor QC problems. Workers carry out only the task assigned in the station and cannot solve major QC problems.
Round 2:
The workload may be sequenced again and/or balanced by the team. Workers may have one assembly only in their job positions (size-1 batch). The assembly may only be placed in the queue when the space is empty (Pull mechanism). Job positions are in the same sequence as work flows. QC problems may be solved by any worker anytime and anywhere. There are no talking restrictions.
Performance Indicators
Production: The number of good products producedCycle time: The time it takes for the first correct product to get to the end of the system
Rework: Number of products with configuration or assembly defects
Inventory of work in progress (WIP): Number of cards being processed at the end of the phase
Production Cost (PC): Calculated considering a price of $10,000/minute (including inspection and idle time)
Cost of Inventory and Rework (CIRW): Calculated considering a price of $100/product
Total Cost (TC): TC = PC + CIRW
Cost per product: TC/Production
| Average Results | Round 1 | Round 2 |
|---|---|---|
| Production (units) | 4.2 | 6.6 |
| Cycle Time (sec) | 156.40 | 123.80 |
| Total Time (min) | 6 | 6 |
| Production Cost ($) | 60000 | 60000 |
| Inventory (units) | 3.2 | 3.6 |
| Rework (units) | 0.6 | 0 |
| Cost of Inventory and Rework ($) | 380 | 360 |
| Total Cost ($) | 60380 | 60360 |
| Cost per Product ($) | 14376.19 | 9145.45 |
Table 1: Average Results
REFLECTIONS
Origami gamification provides an understanding of Pull Planning and demonstrates a Lean principle. It verifies that the system is balanced in all the stations. The specialists cooperate among themselves to understand the conditions of satisfaction of the customer. It reveals the bottlenecks and agreements. Phase 2 simulates the quality control during processes and optimizes the unit cost of each product. According to Alves et al.8: “without a sustained effort to engage people in meaningful learning experiences which mix instruction, exchange of ideas and meanings, and guided practice, Lean Construction may be viewed as a fad in the construction industry.” Pontifical Catholic University of Peru intends to contribute to this effort.
References
1. Tsao, C.C., Draper, J. & Howell, G.A. 2014, 'An Overview, Analysis, and Facilitation Tips for Simulations That Support and Simulate Pull Planning', 22nd Annual Conference of the IGLC. Oslo, Norway.
2. Lean Construction Institute, available at:
3. Ballard, H.G. 2000. 'The Last Planner System of Production Control', Ph.D. Dissertation, School of Civil Engrg., Univ. of Birmingham, U.K., May, 192 pp.
4. Ballard, G. & Howell, G.A. 2003, 'An Update on Last Planner', 11th Annual Conference of the IGLC. Virginia, USA.
5. Alarcon, L.F., 2012. 'Last Planner System', GEPUC, Pontificia Universidad Católica de Chile.
6. Brioso, X. 2015. 'Teaching Lean Construction: Pontifical Catholic University of Peru Training Course in Lean Project & Construction Management'. Procedia Engineering, 123(1), pp.85-93.
7. Shingu F. 2014. A House3, Copyright: Fumiaki Shingo, available at:
8. Alves, T.D.C.L., Milberg, C. & Walsh, K.D. 2010, 'Exploring Lean Construction Practice, Research, and Education', 18th Annual Conference of the IGLC. Haifa, Israel.

