Research and experience with the implementation of the Last Planner System (LPS) in the New Zealand (NZ) construction sector are very few. The NZ construction sector has had a very slow uptake on developing a lean culture and utilising lean tools such as the LPS. The main reason could be that the practitioners within industry are not connected together to share their experiences and collaborate within the local community and with Global Lean Practitioners.
However, since 2014 along with completing my PhD including a case study project in NZ, I have had the chance to study what are the industry requirements and how to support organisations to implement the LPS in a more efficient way. The results of the interviews and surveys (which have been partially presented in my previous research work) showed that more than 50% of the participants acknowledged that LP is not yet accepted or widespread in NZ industry. The results also indicate that the LP tool has not been fully implemented by more than 65% of the users.
The most common use of the LP tool is a Wall Plan and weekly meetings that brings the subcontractors and sometimes the other stakeholders together to develop the lookahead plan either using pull planning or only a common planning approach. While this had some benefits from a visual planning perspective and improve collaboration there is potential to add even greater value utilizing LP’s data.
When for the first time the Spreadsheet dashboard and LP metrics were introduced to a small group of users involved in my case project, the experience started changing as the data captured from the LP weekly meeting and daily check brought far greater insights to the project. This provided a more detailed insight in the processes across the project team particularly key stakeholders like the site managers/superintendent and the alliance board.
This approach known as a Data-Driven model (Figure 1) for the implementation of the LP is initially designed to track the PPC% (Percent Plan Complete), reasons for non-completion and monitor the productivity of different workstreams. The model was then introduced to wider work groups, not only in the case study project, but also across different types of construction works including buildings, housing, and commercial projects.
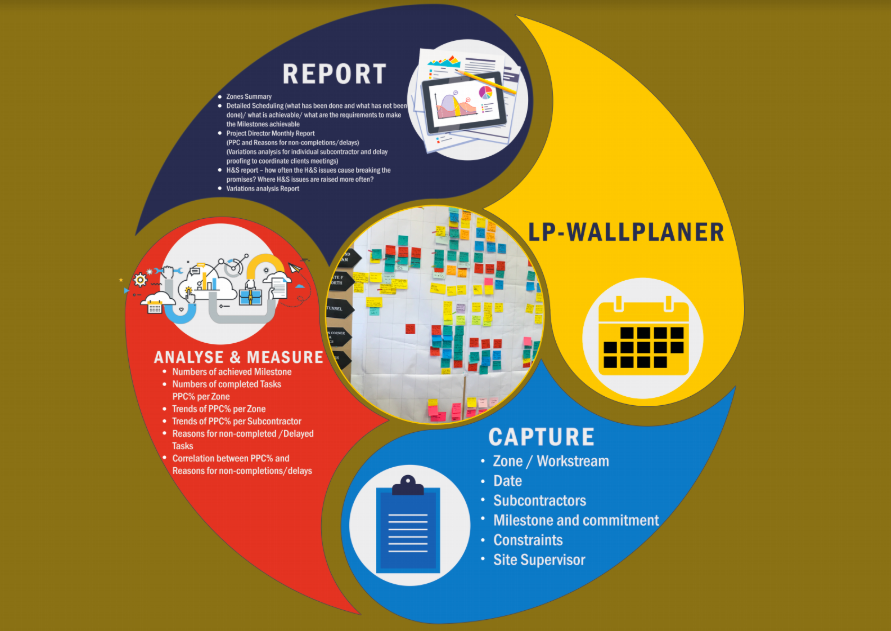
Figure 1. LP Data Driven Model
The LP dashboard was designed and used to present the trend of the progress across different work categories or zones for different resources including the project team and subcontractors that supported them with their decision making in different ways; e.g. resource management, control of the variations (reasons for non-completions/ constraints, unplanned events) and provided a reliable source of evidences for all parties that have been used for coordinating the client meeting, delay proofing, and relationship management.
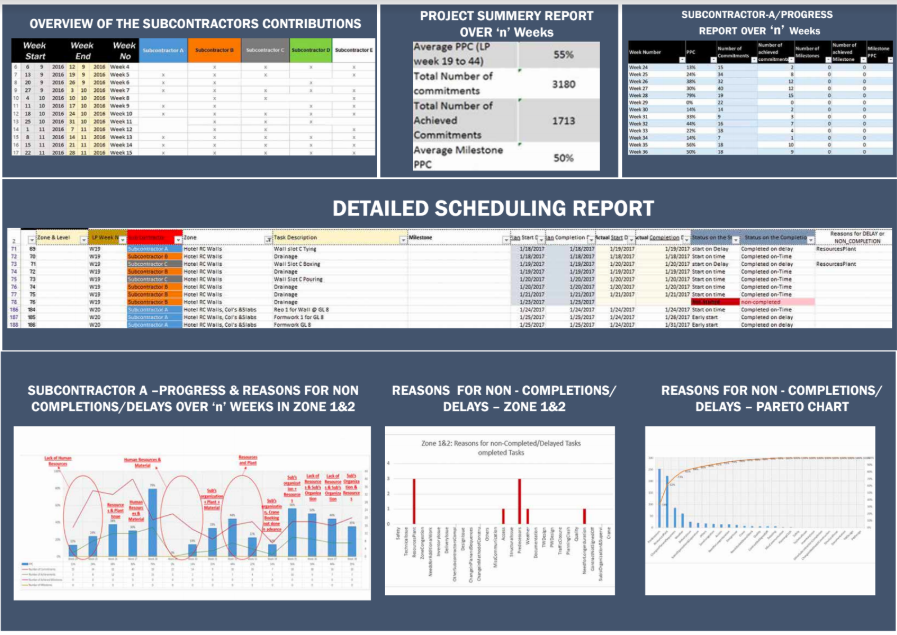
Figure 2. LP Dashboard
This model has had its own challenges as it has been designed and run in Microsoft Excel using Visual Basic application. (see Implementation of the LPS using an excel spreadsheet: A case study from the New Zealand construction industry", Construction Innovation, Vol. 17 Issue: 3, pp.324-339, https://doi.org/10.1108/CI-01-2016-0002 ). The data-driven model successfully increased the level of detail on the many dependencies from different parts of the construction project. Another benefit I observed is that it leads to a change in culture within the projects by having more people wanting to attend the LPS session, reading the LP weekly reports, reviewing the level of contributions of different trades, identifying what and how constraints affect the achievement of the commitments, updating and developing a more reliable schedule and the many tasks. via access the LP dashboard (Figure 2). Practicing in this way and through the value delivered by the LPS enabled it to be more easily introduced to a wider range of audiences including the Project Director, Procurement, Logistics, Health & Safety, Project Resourcing (HR) and Sub-Contractors.
The value of the LPS went beyond the pull planning and operating as a Wall Plan. The LPS data captured and analyzed under this model also supported the projects to coordinate the client meetings, proofing their delays and making their resource utilization more efficient proactively avoiding delays.
This demonstrated the value of the LPS to allow Organizations and Projects within the New Zealand construction industry to develop transparent, auditable and data-driven decisions to deliver better outcomes to all involved. This empowers all stakeholders to make more informed decisions allowing effective management for on-time delivery thus avoiding unplanned delays and cost.

