 Søren Wandahl

The construction industry is continuously searching for ways to improve, be more competitive, and generate higher margins and lower costs. In a competitive construction environment, decreasing costs to increase competitiveness and profits is a common goal among construction companies. Of all the factors influencing project profits, on-site labor costs are among the most influential [1,3].
Just like seeking to remove physical waste, lean also seeks to remove time waste or waste in the processes and the flows. To understand which work activities are waste and value-adding, we can seek guidance in Ohno’s work from 1988, cf. Figure 1.
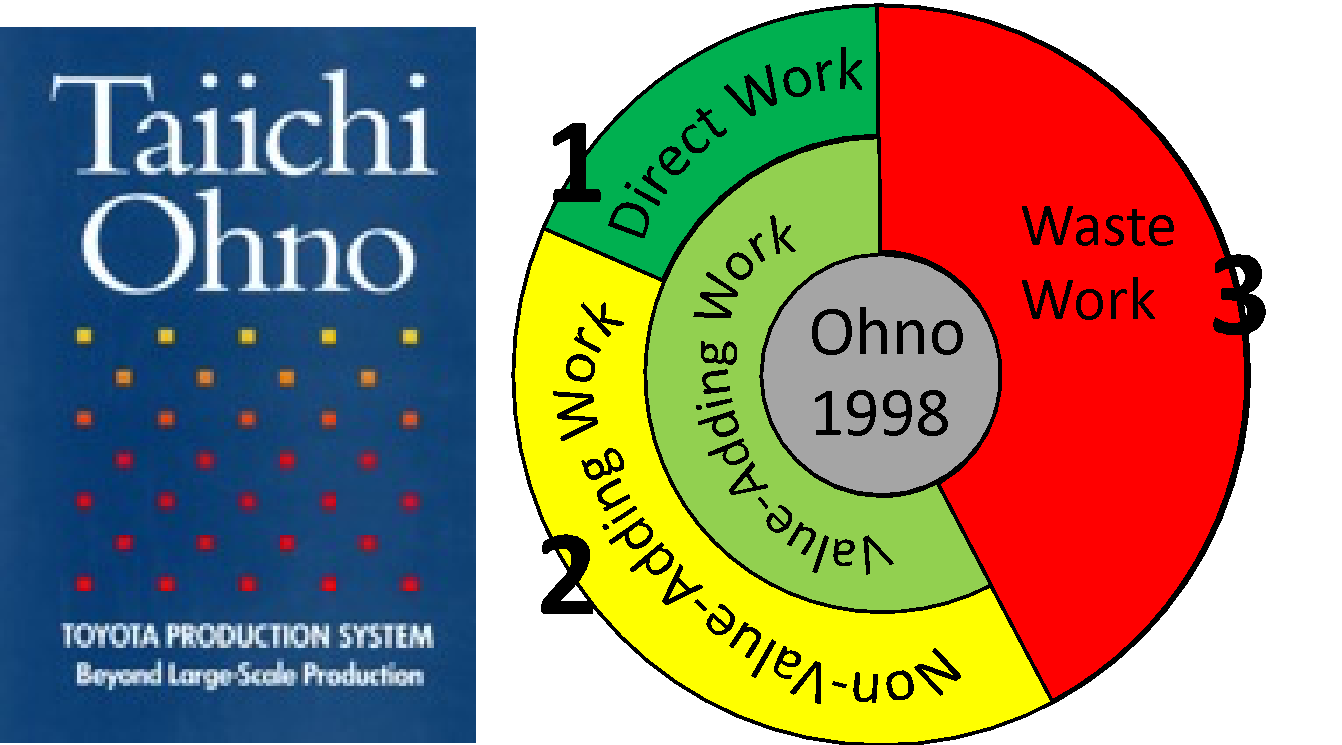
Figure 1: Non-Value-adding Work vs. Direct Work vs. Waste Work (based on Ohno, 1988).
Ohno applies three categories that work activities can fall into. Direct Work is the value-adding installation and transformation. Then there is a lot of preparatory work, which Ohno calls for Non-Value-Adding Work, which could be, e.g., transporting material, cleaning, talking, measuring, etc. The Non-Value-Adding Work category is often debated, as practitioners dislike the “Non-Value” sound of preparatory work, as this cannot be removed entirely. We, therefore, often refer to this category as Indirect Work. The last category is Waste Work which could be, e.g., waiting time, unnecessary movement, etc.
Many agree that Work Sampling is currently the most suitable method for measuring time waste in construction [2, 4]. The Work Sampling method has been used since the 1970s to collect data on how work time is distributed in Direct Work (DW), Indirect-Work (IW), and Waste Work (WW), very similar to Figure 1. The WS method is quantitative and uses direct observations to obtain data on how workers use their work time. Work Sampling is an excellent benchmark tool for any improvement process to make planning and execution on the construction site more efficient.
In the paper ”What a Waste of Time” we reviewed published Work Sampling studies, which included 474 case studies from around the world on time waste measures from the 1970s until today. When analyzing the sample, one can see that it contains significant variances. However, there is a stable, perhaps declining trend in DW, as seen in Figure 2.
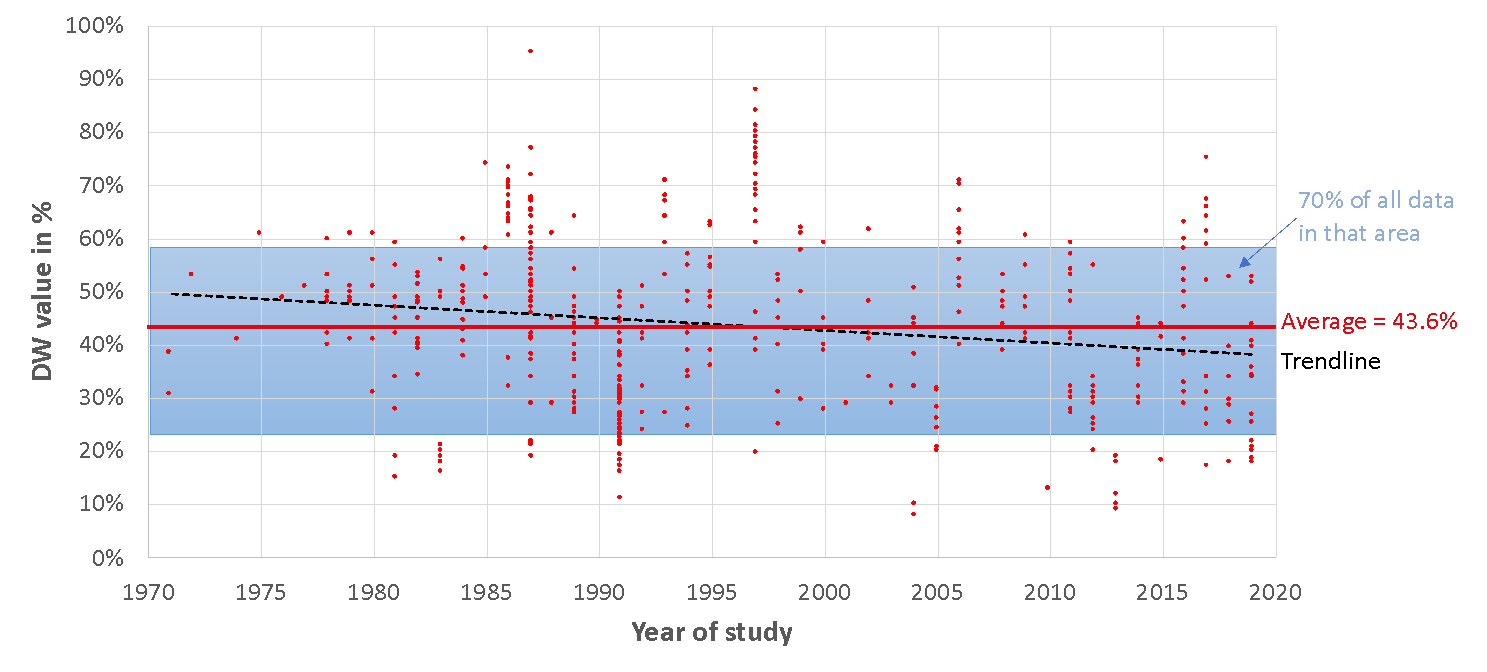
Figure 2. Direct Work (DW) rates from 474 Work Sampling case studies.
The average DW rate in the sample was 43.6%, however, with a large standard deviation of +- 16.5%. 70% of the sample was in the range of DW from 24% to 58%. All this is illustrated in Figure 2.
The significant variance is mainly due to inconsistent use of DW and IW. To distinguish between DW and IW can be difficult, and we often experience practitioners that argue for IW tasks being DW. An example is illustrated in Figure 3.
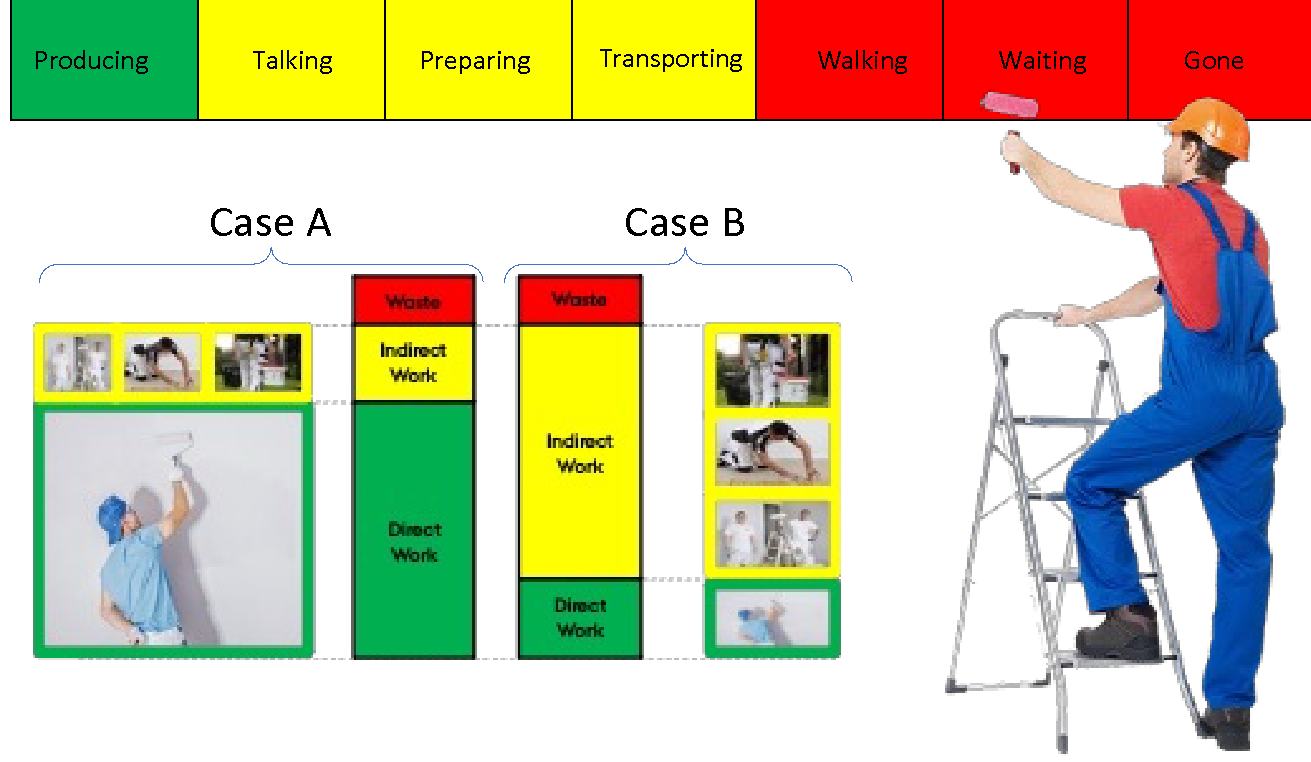
Figure 2. Direct Work (DW) rates from 474 Work Sampling case studies.
A painter needs to paint a room. Before painting can begin, the painter uses time to cover surfaces, move and prepare materials, etc. This is productive work, argues some painters, as it is required to do. Ohno, on the other hand, would argue that this is preparatory work (IW), and only painting the wall itself is DW. Figure 3 shows a simple illustration that proves Ohno is right. Case A on the left side and Case B on the right side have the same amount of waste time. But painter B, on the left side, uses much more of his time on preparatory work compared to painter A who uses most of his time on painting. Who do you think will complete the task first? For sure, this is painter A. This is exactly why it is important to distinguish between direct work and preparatory work, as this is the only way it becomes visible, and thus focus can be put on reducing it.
In conclusion, Work Sampling is a great benchmark tool for adopting a data-driven approach to measure and reduce time waste in construction. The work Sampling must include categories of Direct Work, Preparatory Work, and Waste Work. The aim is to have as much Direct Work time as possible, as this will increase productivity and lead to faster construction completion.
This post was based on the IGLC paper “What a waste of time” by Wandahl, S., Neve, H.H., and Lerche, J. presented at IGLC29, Lima, Peru.
References:
[1] Gouett, M.C., Hass, C.T., Goodrum, P.M., & Caldas, C.H. (2011). “Activity Analysis for Direct-Work Rate Improvements in Construction.” Journal of Construction Engineering and Management 137(12), pp. 1117-1124
[2] Kalsaas, B.T. (2011). “On the Discourse of Measuring Work Flow Efficiency in Construction. A Detailed Work Sampling Method.” In 19th Annual Conference of the International Group for Lean Construction, Lima, Peru.
[3] Moselhi O. & Khan Z. (2012). “Significance ranking of parameters impacting construction labour productivity.” Construction Innovation 12(3), pp. 272-296.
[4] Pérez C.T., Salling, S., & Wandahl, S. (2022). “Location-Based Work Sampling.” In 30th Annual Conference of the International Group for Lean Construction, Edmonton, Canada.