Dennis Sowards

One Wall Street CEO claimed, “That today’s businesses are drowning in data.” Managers have more data than ever before and more powerful computers to crunch the data, but they still lack the ability to turn the measures into meaningful actions. Another manager, when asked about a daily job’s PPC chart, responded that “some days are better than others!” This paper will share some basic principles and tips for analyzing data to help you manage better.
Facts about data and measures:
- It’s not that we don’t measure things. We measure all the time - we measure everything! What time is it? What does it cost? How many workers are needed? These are examples of things we measure.
-
We have problems with measures.
- We over measure.
- We misuse measures.
- We don’t use measures.
- What gets measured gets actions. The action may be right on target. But sometimes we measure the wrong things leading to useless or even damaging actions. For example, a police station posted, in descending order the number of traffic tickets issued by each officer the previous month, with no explanation why these numbers were posted. The next month the number of tickets issued increased substantially.
- We should only measure data to analyze it to improve processes! We can’t consistently improve a process without feedback and analysis! If we don’t analyze data, there is no need to measure it!
- We measure to understand what’s happening and to communicate that information in a common language.
-
We think we do but in reality, we aren’t measuring individual people’s
performance - we
actually measure the systems and processes they work in! Consider the plight
of the
front-line workers on the job site or in the shop:
- Who sets the company’s strategy?
- Who picks the customers & projects?
- Who sets policies?
- Who buys the material and tools?
- Who plans the work?
- Who makes the daily assignments?
- Who buys the computer applications & hardware?
- Who determines and delivers the training?
Not them, yet managers mistakenly think they are measuring the workers’ performance.
There are three ways managers often react to poor performance:
- Improve the process
- Distort the system
- Distort the data
Unfortunately, managers, will all too often, distort the system or the data.
Measures can be our friend - a useful tool to improve performance if we learn how to organize data and understand it.
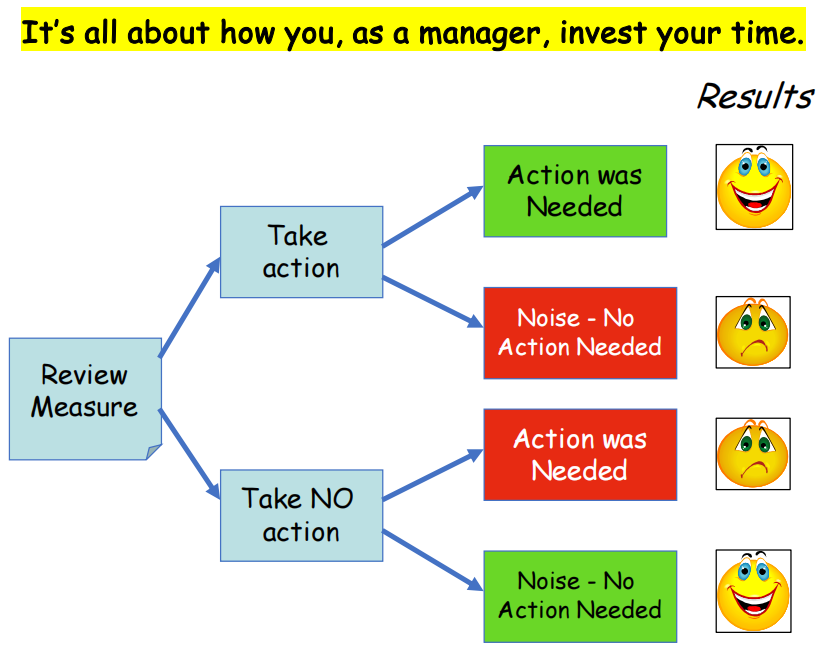
Managers have limited time and must decide where best to invest it to improve. Taking action consumes the manager’s and workers’ time. When reviewing measures, what actions does one take or not take as a result of the data? Measures can only show three possible outcomes:
- Better than the last time
- The same as the last time
- Worse than the last time
Is being better, worse or the same, from the previous period, significant enough to warrant action? Consider the possible outcomes of taking or not taking action:
- The manager takes action and action is needed. This is the best outcome and, if consistently done, will get the manager promoted.
- The manager takes action but action is not needed. This is a waste of time and resources.
- The manager did not take action but action was needed. This is the worst outcome and if consistently done, someone will free up the manager’s future.
- The manager takes no action and action was not needed. This saves time and resources.
How to determine if action is needed? Analyze the measures looking for:
- - The level of activity - compared to what?
- - Direction or trend of the data. (Is it getting better or worse than it was?)
- - The rate of change or how fast the measure is moving?
Compared to What?
-
Compare to history:
- - Compare the current measure to an average of the past. Two data points tells very little, we need 15 or more data points. Averages are very easy to calculate. But using an average is like only using the rear-view mirror to drive down the road. History may not be the future. It only shows part of the picture. By definition, an average always Review Measure Take action Take NO action Action was Needed Noise - No Action Needed Action was Needed Noise - No Action Needed Results It’s all about how you, as a manager, invest your time. means half of the data will be above the average and half below, so if the next data point is above or below is that really significant to take action?
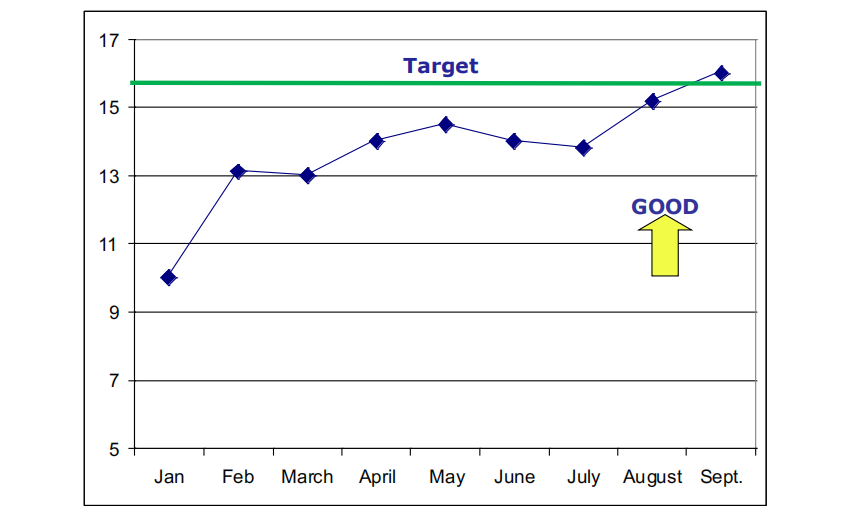
- - Compare the current measure to a Target or Goal. Use industry averages, best-in-class, world-class or set your own desired goal. This makes sense because it is looking where you want to go. However, the methods used to calculate or derive a target are not always sound. Some managers pull a number out of the air. Industry or best-in-class numbers are sometimes hard to get. Remember too, that workers may respond in wrong ways to reach a goal, especially if rewards are involved. They may distort the system or distort the data.
Ways to decide if Action is needed
- Manage by Luck: Flip a coin, roll dice, use the stars, or just guess. This is really easy to do, but do you feel lucky?
-
Management by Exception: Assumes the bigger the change, the
bigger the need to take
action. Or see if the current measure is over the acceptable level (line) to
take action.
This is very logical and defendable. But where is the line? Note that using
a percent
change, instead of actual units, can hide significant change. Consider which
project has the
biggest loss?
- Project A lost 2% of $100M
- Project B lost 20% of $1M
- Critical Thinking: The action depends on the nature of the cause. Determine what caused the change. This is sound, proven logic. To apply, one must understand the logic of ‘causes.’ We measure processes to determine if the process is in or out of control.
If the process is in control, then any deviation is considered to have a common cause. To make improvements, one must not go after the root cause of a specific deviation but seek to improve the process. All results have a cause, but implementing a countermeasure to a common cause will not improve the process.
A process is out of control meaning that there is a special cause that produced the current result. Finding its root cause(s) to prevent/minimize it will improve the outcomes.
How to know if the measure’s current data point is a common or special cause?
- Special Cause situations: the current measure is far outside the average. (Basically, three standard deviations from the average). Don’t sweat the statistics, just look for wide distances from the average.
- Also look for inside patterns such as:
- 6 data points in a trend (row)
- 9 points all on one side of the average
- Other patterns such as one point above the average and the next below, repeating itself.
- These situations suggest there is likely a Special Cause situation. Seek countermeasures to stop/minimalize the root cause.
- If there are no observable patterns or extreme outliers, then it is probably a Common Cause. Don’t spend time looking for a root cause but focus on improving the process.
Management Responsibility:
- Bring the process into control by eliminating Special Causes.
- When Common Causes exist, improve consistency of the process. This may require more training, better or more tools, clearer standards, a change in policy and/or a redesign in the process itself.
- Improve the process. Narrow the variation and try to shift the average. Change the steps, eliminate non-value-added steps (use Lean Value Stream Analysis). Go to Gemba and ask the workers then Listen and Learn.
A best practice is to show the target/goal and a “Good” Arrow on any chart.
Managers can expand their analysis skills by learning how to us these simple tools:
- Run Charts
- Pareto Charts
- Scatter Diagrams
- Bar & Pie Charts
- Histograms
- Control Charts
Managers should always seek to engage employees in what is being measured and what it means. Open communication, as being on the same team, will especially help in making improvements.
For more detailed information about Critical Thinking in a very easy to read format see: Understanding Variation: The Key to Managing Chaos, by Donald J. Wheeler, ©2000, SPC Press.