 Olli Seppänen
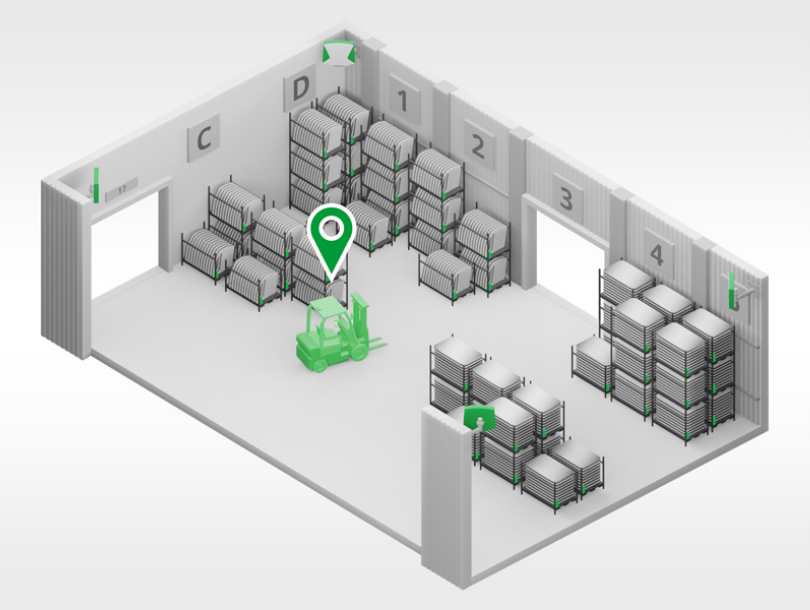
Flow in construction can be divided to process flow, operations flow and portfolio flow (Sacks, 2016). Various metrics have been proposed to measure flow but they are typically based on completing assigned or promised tasks (e.g. PPC of Last Planner System, Ballard 2000) or by analyzing start and finish dates of activities (e.g. the Construction Flow Index, CFI, Sacks et al. 2017). However, especially operations flow is by nature a more continuous phenomenon which is difficult to evaluate with these daily or weekly level metrics.
Poor operations flow is experienced by the worker as disruptions or discontinuous work. An example of a break in operations flow would be starting work in a location only to find out that all the required materials are not there and then going to look for materials. The problem with current metrics is that commitments to schedule or assignments are based on assuming the same level of operations flow as achieved in previous projects. This “black box” effect is included in all schedules and all commitments. A lot of problems remain hidden and limit the amount of improvement that can be done.
Previous attempts to directly measure operations flow have used, for example, time motion studies (e.g. Kalsaas 2010) or work sampling techniques (e.g. Josephson & Björkman 2013). These methods categorize the time spent by workers into buckets and analyze the share of value-added time and waste. Analysis is quite time-consuming. We have a current research project ongoing where 14 plumbers and electricians wear a hard hat with a camera attached. The analysis to categorize time on the second level of accuracy takes almost two hours for every hour of video. Because we have collected more than 400 hours of video material, the analysis will take roughly 800 hours. Although we will learn a lot of typical problems and waste encountered by plumbers and electricians in their daily work, this is not a real-time approach, which could be used to identify poor operations flow by project teams and do something about it.
Indoor positioning systems could provide data for a rough real-time measure of operations flow. A system based on, for example, low-energy Bluetooth beacons and gateways can show where workers are on the construction site (Figure 1). Because poor operations flow can often be seen as continuous movements away from the work area, measuring the share of time that workers spend uninterrupted in the work area is a rough metric of operations flow. It will not be able to capture all breaks of flow because time motion study data shows that the flow is constantly broken by interruptions happening inside the location. We are currently investigating how much is missed by cross-analyzing indoor positioning and hard hat camera data. However, in any case, it gives a good starting point for continuous improvement because workers cannot have good operations flow when they are moving in and out of their assigned work location! Presence in a work or prefabrication location is a necessary but not sufficient prerequisite for value adding installation work to happen.
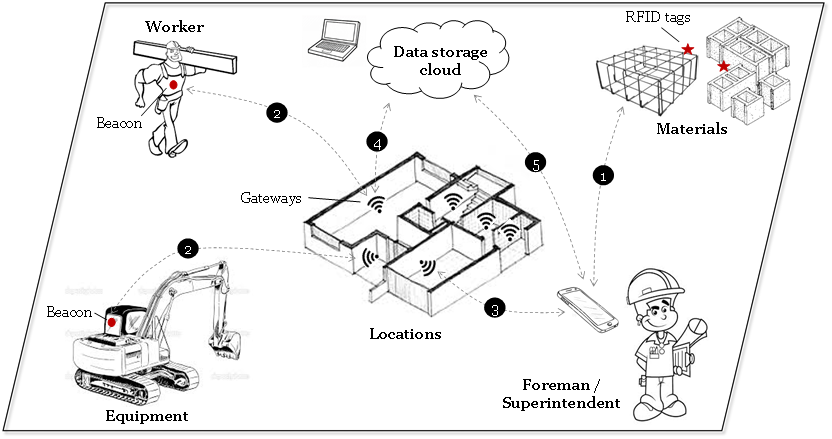
Figure 1: Indoor positioning system has gateways in work locations and coin-size beacons can be used to track workers, equipment and materials (From Olivieri et al. 2017)
Our tests have given promising results. The share of uninterrupted presence of more than five minutes in any work location has been 25-40% (Zhao et al. 2019). Data from one case project is shown in Figure 2. When we go to task level, achieving the planned schedule requires on average just 33.8% of uninterrupted presence during work time (Zhao et al. 2021). Variability in all projects we have measured has been huge with some trades being able to work without interruptions while others have very low presence indices in all locations. The analysis can show in real time those tasks with problems in operations flow and subject them to root cause analysis. Getting more details on why the presence index is small will still require more data but at least the lowest hanging fruits for improvement can be identified and the impact of lean interventions can be evaluated.
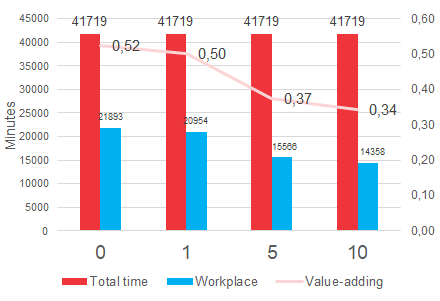
Figure 2: Presence in work locations as percentage of total work time. Y-axis has the threshold time. E.g. 0 means that any presence in work location is included while 5 requires five minutes of presence without moving to other work locations.
Tracking people on work sites obviously includes some privacy and ethical concerns. Our approach in Finland has been to involve the trade unions in discussions. Because productivity increase naturally impacts the wages of workers, trade unions are typically interested in reducing wasted effort. Wasted effort is a common enemy of both the employer and employee. Waste is a systemic issue and cannot easily be reduced by the worker him/herself. Everyone needs to participate, including the Owner, designers, General Contractor and other contractors. For research purposes, it has not been difficult to get workers and employers to participate. However, it remains to be seen if the contractors and labor unions will be able to reach a consensus on wide-scale implementation of such systems.
References
Ballard, H. G. (2000). The last planner system of production control (Doctoral dissertation, University of Birmingham).
Josephson, P. E., & Björkman, L. (2013). Why do work sampling studies in construction? The case of plumbing work in Scandinavia. Engineering, Construction and Architectural Management.
Kalsaas, B. T. (2010, July). Work-time waste in construction. In Proceedings of the 18th Annual Conference of the IGLC, Technion, Haifa, Israel.
Olivieri, H. , Seppänen, O. & Peltokorpi, A. 2017, 'Real-Time Tracking of Production Control: Requirements and Solutions' In:, 25th Annual Conference of the International Group for Lean Construction. Heraklion, Greece, 9-12 Jul 2017. pp 671-678
Sacks, R., Seppänen, O., Priven, V., & Savosnick, J. (2017). Construction flow index: a metric of production flow quality in construction. Construction management and economics, 35(1-2), 45-63.
Zhao, J., Seppänen, O., Peltokorpi, A., Badihi, B., & Olivieri, H. (2019). Real-time resource tracking for analyzing value-adding time in construction. Automation in Construction, 104, 52-65.
Zhao, J., Pikas, E., Seppänen, O., & Peltokorpi, A. (2021). Using real-time indoor resource positioning to track the progress of tasks in construction sites. Frontiers in Built Environment, 7, 59.