 Miguel Angel Alvarez Perez
Lean Construction is based on the studies of Professor Lauri Koskela in 1992 during his stay at Stanford University in California and his collaboration with Professors Glenn Ballard and Greg Howell.
Its foundations are the Lean Manufacturing System based in turn on the Toyota Production System, which the engineer Taiichi Ohno had developed in this company from the 1950s, for the improvement in the manufacture of their automobiles.
One perspective of looking at Lean Construction is the translation and application to the construction of the principles and techniques used in Lean Manufacturing and in Toyota, considering the specific characteristics of the construction industry.
Basically, it focuses on the elimination of all the waste (“muda” in Japanese) that occurs during production and on satisfying the value delivery of the product to the customer, using only the processes and means that are strictly necessary.
Professors Glenn Ballard and Greg Howell defined construction in their speech before the International Group of Lean Construction (IGLC) in 1998 in the following terms:
“Construction is essentially the design and assembly or mounting of fixed objects on their site. Consequently, it puts the production characteristics in that place, developing unique products made by temporary work teams.”
Later, Professor Greg Howell, for his part, in his speech before the IGLC in 1999, established that managing a project under the Lean Construction philosophy means:
“Have a set of clear objectives for the development of the project and the work.
Focus on maximizing performance for the client at the project and site level.
Simultaneously design both the product and the process.
Apply production controls throughout the life cycle of the project and the work.”
The techniques used to achieve these objectives are very diverse, this time I will focus on Value Stream Mapping or VSM, which belongs to the last of the sections that I have previously outlined.

It is evident that to improve and fine-tune a flow of production processes it is first necessary to know it thoroughly, for this we must analyze each one of those involved, as well as the rate at which they occur.
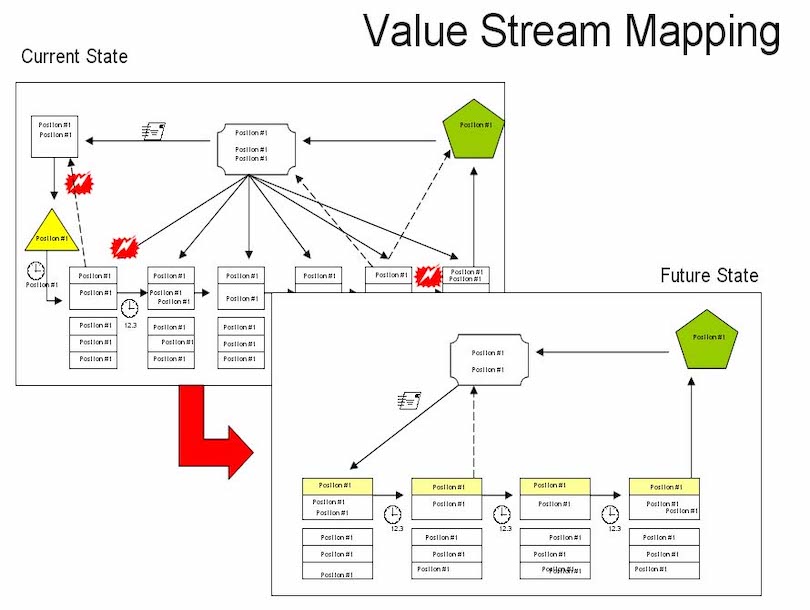
Once detected, together with the production flow, we can decide which ones can be improved or simply eliminated, without affecting the value that the customer expects from the product, and capture the new process flow in a diagram, this is Value Stream Mapping.
Applied to construction and considering that a wide variety of products are generated in this sector in different phases of activity, it is very complex to visualize the entire process in an integral way, so this tool can be a great help.
In the first place, the current way in which construction production is developed will be studied, and a Current Map will be drawn up, which will reveal to us which are the sources of losses, and which are the opportunities for improvement.
It is important to assess consensus in this step, so it requires the input of all who are participating in the process thus strengthening the path of improvement of collaboration among all.
It should begin with the end in mind and be focused on the customer, its writers may need the utilization of other lean tools like A3 Diagram and Root Case Analysis.
The minimum team for this work should include:
- A facilitator.
- All the team working closest to the work.
- The customer.
For its redaction they should:
- Identify a process to study.
- See deeply the process collecting actual data.
- Avoid assumptions about it.
- Identify and discuss opportunities to improve.
- Document the changes required.
Based on this analysis, the Future Map will be drawn up, in which those unproductive processes will have been eliminated and those that had room for improvement will have been improved, always bearing in mind that the quality of the product that we are going to deliver to the client, as a result, must be the same.
The panoramic vision that both maps offer us, and their comparison through graphs and diagrams, constitutes a very valuable tool for the continuous improvement of the organization. Its visual representation makes all those involved in it see it clearly.
Based on it the team can better determine which steps are adding value and which are not and seeing the comparison between both maps, the participants may remove waste, eliminating or improving some steps of the process.
Value Stream Mapping is an effective technique to simultaneously improve productivity and detect losses of all kinds that occur in construction.
Example:

From J.C.Gatlin Blog Lean Homebuilding, 2010
References:
1. “Learning to see: Value Stream Mapping to add Value and eliminate Muda” (Rother M & Shook J., 1999).
2. "How to build a Value Stream Mapping (VSM)?: Step-by-step methodology, detailed explanations, examples, tips and tricks" (Réquillard M., 2020)