 Victor R. Ortiz
How do we develop our ability to identify waste, ascertain its causes and implement a lasting correction?
This third installment of a three-post series provides several pictorial examples of the “Muda, Mura and Muri”, as explained in Post #2. Our first post focused on the concepts of “waste”, “value” and “the pursuit of perfection”. This post suggests a simple template for use when you take a “waste walk” around your worksite and discusses the process of “Root Cause Analysis” – the identification of what must be changed to eliminate waste at the causal level.
First, let’s recap some key points from Post #1 and Post #2:
In order to identify waste in our operations, we need to See what we are looking at differently using a new set of Lean lenses. This new perspective results from the application of the Five Lean Fundamentals which you should have memorized by now: Customer-defined Value, created by Workstream that must Flow when there is a Pull to act, subject to Continuous Improvement.
In Post #2, we defined the classic Japanese definitions of waste, called “Muda (8 wastes), Mura (Unevenness), Muri (Overburdening)”, each with discussion of what you might see around the design and engineering office or the construction site.
Systematic identification and analysis of wasteful practices has been essential to the development of Lean principles and Operations Science. As we ferret out what causes imperfection, we begin to see patterns in the design of our work systems that lead either to failure or success. We can turn those observed patterns into guiding principles and scientific laws of cause and effect. If these guiding principles are any good, they necessarily will challenge the assumptions and ways of thinking that led to the previous failures.
Management guru, Peter Drucker said:
“There is nothing so useless as doing efficiently that which should not be done at all!”
If you take away nothing else from this third post, please absorb this fundamental truth:
Every project failure or success is caused by choices that we make, moment to moment, day to day. People make the best choices they know how to make, often unconsciously and habitually, based on their underlying mental models of “reality”. Therefore, root-cause analysis, if taken far enough, will always drive us to examine our underlying mental models, i.e., the reasons for the choices we make. Lasting improvement requires us to learn about and to improve how we understand the world and systems around us and how they work.
The Lean Fundamentals provide a new set of lenses through which to see and analyze our work systems. You can exercise your Lean Lenses by taking a “Waste Walk” around your work site. The Japanese call this going to “gemba” the shop floor. Here is a simple template that you can make and modify for your use:
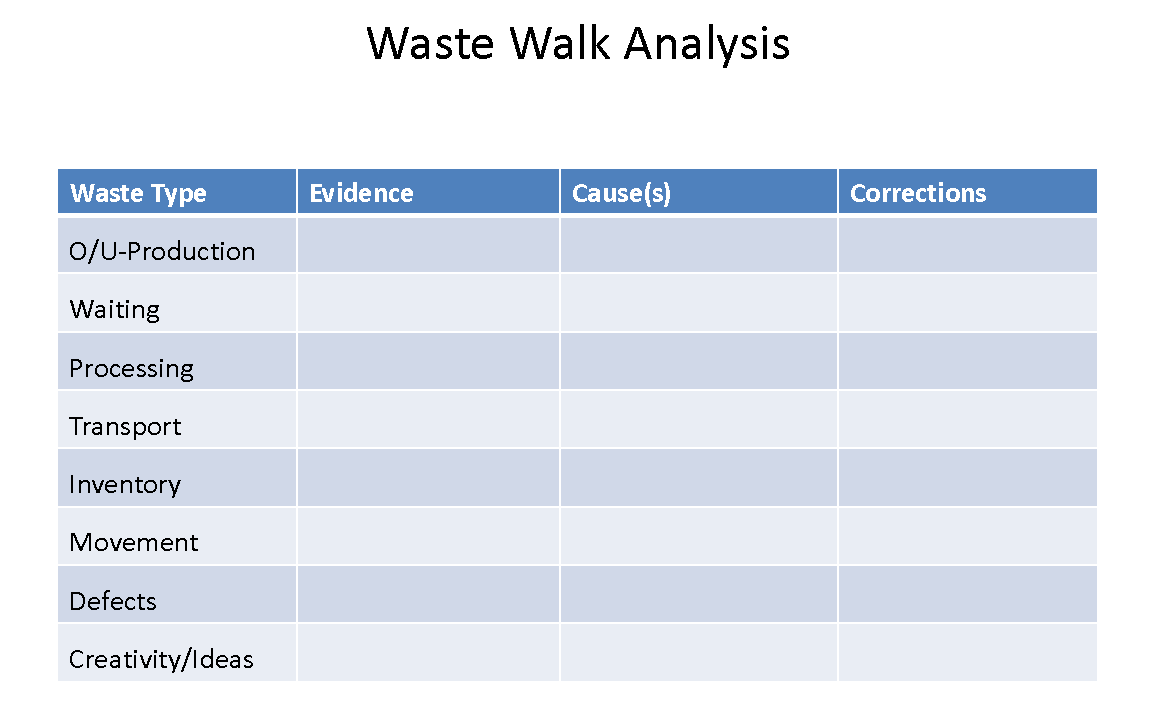
Use one of these templates for each situation you encounter – take a picture and attach the template. The “Evidence” in your photo usually suggests one or more waste categories. Cause(s) take some digging. Simply asking, “Who screwed this up?” is not enough. Almost always, the situation was the result of multiple individuals doing their best to do the right thing, given how they understand what “the right thing” is. W. Edwards Deming, a father of Total Quality Management, reminds us, “Every work system has inherent limits on how well it can produce a quality product. No one can outperform the limits of the system in which they work.” Therefore we must apply Lean Fundamental #2 to understand the stream of activity that led to the situation.
Sometimes, the failures of our work systems are obvious no matter what our underlying metal models. For example…
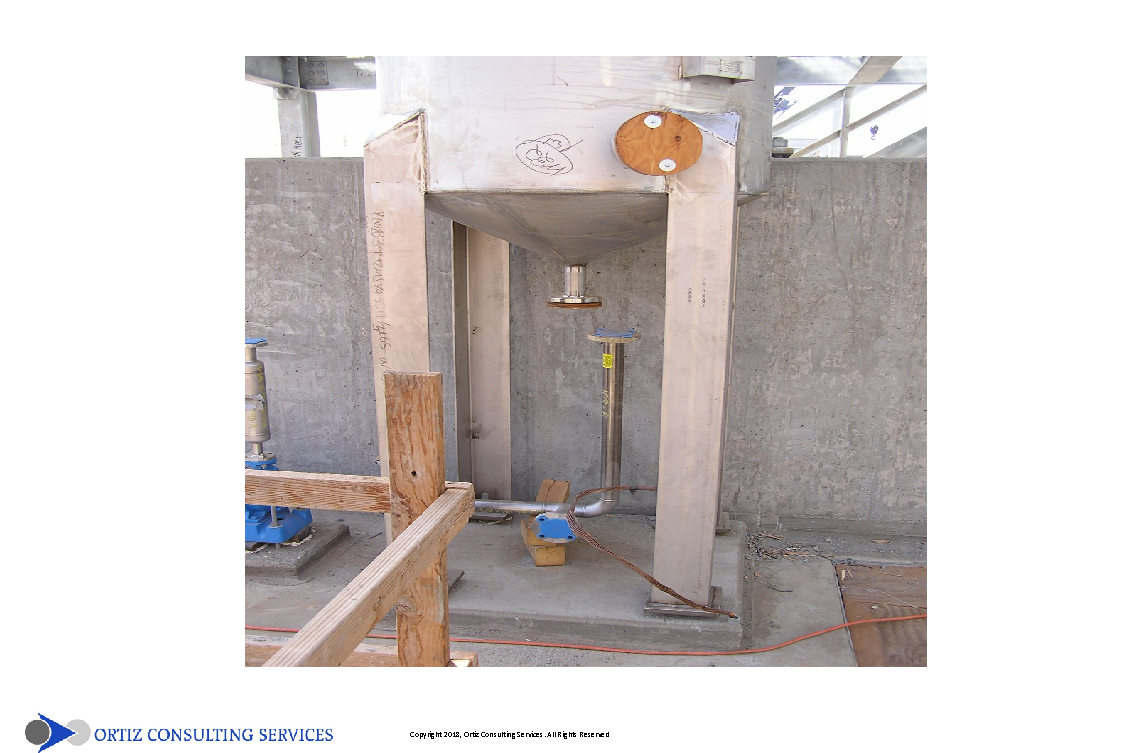
Here we have a tank, a pump anchored to a formed pedestal, and a prefabricated pipe spool that is supposed to connect the two. Hmm. What’s wrong with this picture?
The Error/Defect waste is obvious from the misaligned flange. Less obvious from a picture are other wastes, such as Waiting. This situation had existed for many weeks, uncorrected, when I took this picture. We also have WIP – an inventory of work in process that adds no value in its current state. Rework will require Transportation and additional (“over-“) Processing. What caused this?
From the picture we cannot tell if the root problem is a design error, or prefabrication error or a site installation error of some sort. During problem analysis we found out that the tank pedestal and tank were installed correctly first and the original design dimensions for each element overall were fine. By chance, as work progressed in this work area additional site surveying activity found that a critical survey marker had been placed in a heavily trafficked and unprotected location. Heavy equipment had run over it and moved about 10 inches. The pump pedestal and presets were placed using the moved marker. The stainless spool was prefabricated off-site without measuring the actual location – likely because it was a longer-lead item, and costly.
If we follow Deming’s logic, we must look at how the whole system was set up and the underlying assumptions about how work should get done. On this project there were a variety of sub-contracted trades, each working under their respective low-bid contracts with razor-thin margins. Each was responsible for their own piece of the puzzle with no incentive to collaborate, which would presumably consume time not built into their bids. They were paid using EVA (Earned Value Analysis) which created incentive to build and bill for the highest claimable “percent complete” as early as possible. Subcontractors could claim that they each performed perfectly, had consumed their available capacity, and would need an approved change order to make corrections. The production system was working perfectly as designed. It was designed with the assumption that if each trade just does it’s respective job perfectly at the lowest possible cost everything will be great. This traditional project organization leads to what Lean calls, “Optimization of the sub-system, while sub-optimizing the whole system.”
The simplest corrective action, modifying the pipe spool to fit, still requires wasteful rework, and probably more Over-processing and Waiting waste as the stakeholders fight about who will pay for the corrections. Solving the immediate problem could likely have been done in a day by a qualified pipefitter. Many corrective actions will stop there, having barely scratched the surface of the conditions that led to the situation. The only way to get at the root cause is to replace a system that discourages collaboration and shared accountability, rewards acting in self-interest, though with the best of intentions, and is constrained by contractual misalignment. Rethinking the project production system is no small task – a realization that likely drives much of the resistance to Lean practices that we so often face.
An effective, but often misunderstood tool for root-cause analysis is “The Five-Whys”. The approach was developed in the factory assembly line setting. When an error was detected at any assembly station along the line, such as a part not fitting correctly, the practice was to stop the line and work backward up the line, each time asking “Why?” the error happened. There was no magic to “Five” whys. The point was to continue digging into the process until a correctable cause was found and a solution implemented to prevent any such future errors. Going back up the line, back up the workstream, or back in time, is sometimes also called “regression analysis”. In the situation above, we had to do analysis of each of the elements and trades. Some elements took only a single “why?” to validate correct installation. Other elements required understanding the sequence of the work stream on site, mentally and visually creating the construction site equivalent of the factory assembly line, to identify where breakdowns occurred. The “5 Whys” could be applied to any breakdowns.
Some cases are more easily analyzed with a simple series of “Why?s”. It’s hard to find a more linear example than a pipeline – or two, or three? Here is another example with a couple of photos.
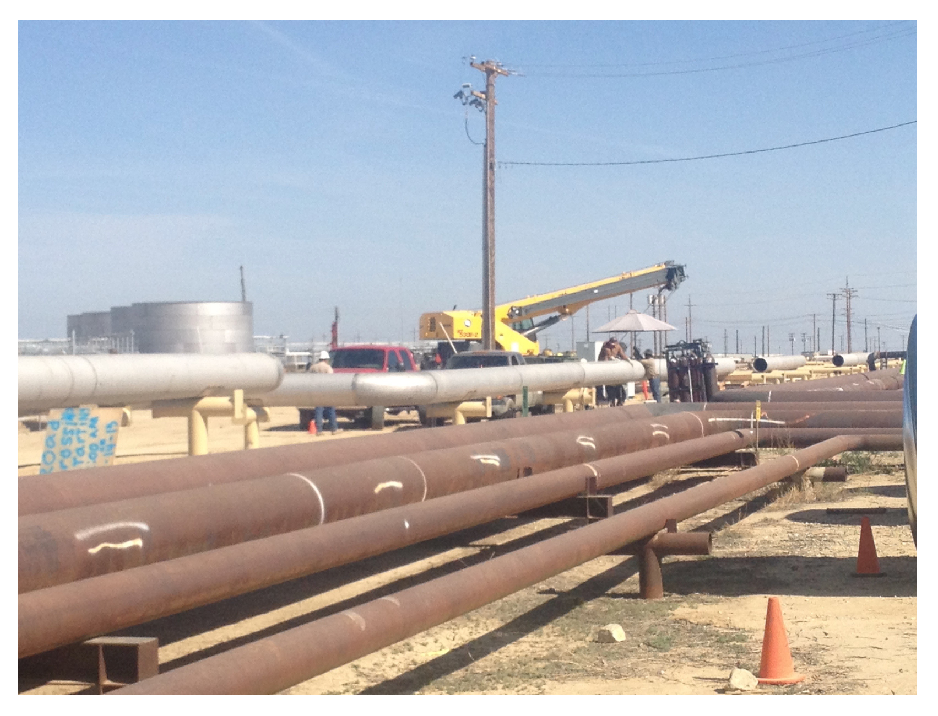
This situation takes place in a mature, well developed, congested oil field. Oil and gas are contained in porous rock formations hundreds of feet down. Fracking chemicals and high-pressure steam are pumped into the rock to cause fracturing from expansion and loosening of the oil through heat and chemicals to facilitate extraction. Extracted liquids settle in large tanks and the water and other materials get siphoned off for cleaning and reuse. This project is to install a new set of stainless pipes, to be configured like the rust-coated pipes in the foreground. Note the variance in diameter in the foreground. It clearly makes sense to install the largest diameter spools first and furthest back to facilitate access to each successively small diameter pipe and avoid having to lift heavy spools over smaller, more easily damaged spools. Pipelines like these can only extend so far before a U-shaped expansion loop, visible in the stainless pipe in line with the distant tanks, is required. Note that the stainless spools are being set out in the distance atop the yellow, pre-set pipe supports, ahead of the welding crew. Simple. What could go wrong?
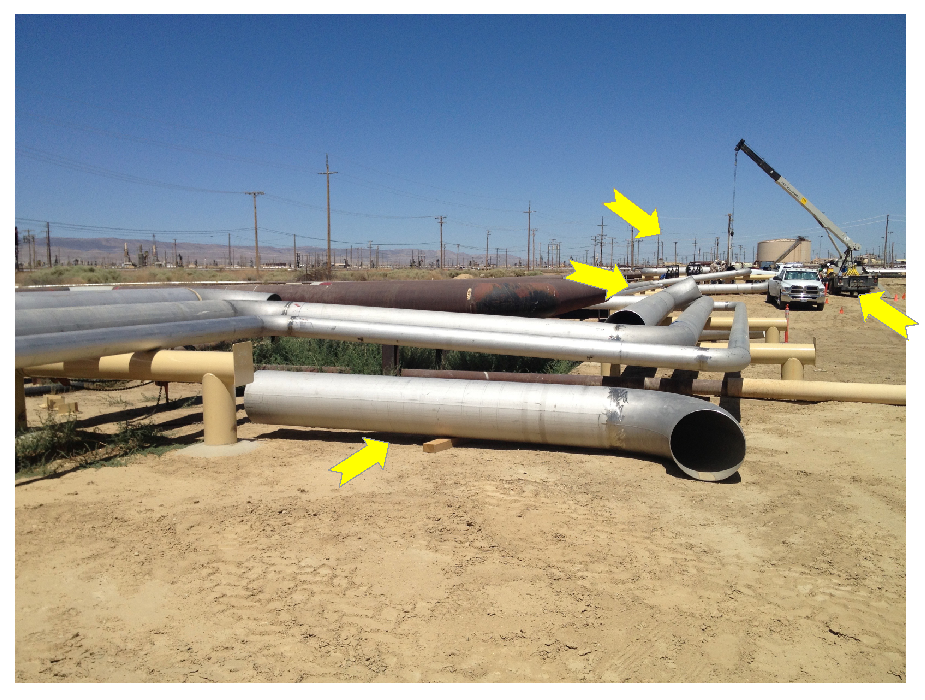
Here is the scene further down the line. What signs of what kinds of waste in the production system do you see? How would you go about problem-solving to find and fix the root cause?
Again, the presenting situation is obvious, on the surface. There are four diameters of pipe in the system including the largest rust-colored pipe and the three successively smaller stainless systems. At least two spools, prefabricated with 90-degree elbows welded on, were left out of the construction of this expansion loop and apparently have been missing long enough that the smallest two lines have already been installed, blocking access to the third largest line. The welding crew is down the line working on more spools inside at least the outermost, smallest line. This does not appear to be a unique instance. Our nice, logical installation plan has fallen apart somehow. We need some analysis.
Among the identifiable indications of waste are:
- Defects/Errors – this time not in the materials, but in the material supply process
- Movement – crews, materials, welding equipment, cranes, etc. are shuffled back and forth along many miles of pipeline. Crews and welding equipment must be lifted into now-confined spaces risking safety and quality. Running crews all over, crawling over an under pipes is also an example of Muri – overburdening.
- Over/under processing – spools left out in the desert get full of dust and other debris and field repairs, particularly of cement-lined spools that dry out and crack if not kept moist, are common
- Inventory – in the form of WIP exists here, and in how many other places?
- Waiting and Employee Creativity – here we see a creative solution to the problem of capacity waiting for work. Spools are installed out of sequence to optimize available capacity while sub-optimizing the overall production system. Finally, spools get delivered out of sequence and now we have work waiting for people – a great example of Mura (unevenness of flow).
In this situation the “5 Whys” root cause analysis is more linear:
- Why were pipe spools installed out of sequence? Because some spools were missing, and other diameter spools were available to the crew who needed work to do.
- Why were some spools missing and others available? Material availability was dependent on delivery batches and coordination with pipe spool fabrication.
- Why did delivery batches mix and match these different spool sizes? Because the fabrication logistics office was tasked with utilizing the fullest capacity of the transport trailers to reduce cost. This is a common logistics subsystem success measure.
- Why were spools being fabricated and delivered out of sequence? Because the whole job was bid on a fully designed scope of work allowing the fab shop to optimize capacity across numerous competing customer demands.
- Why didn’t the field and the fab shop, both divisions of the same company, better coordinate demand (pull) and supply? Because the field installation work and the fabrication work were organized as separate corporate divisions, each tasked with and evaluated on how well they keep their capacity fully utilized, without regard to the effect on the performance of the project as a whole.
There was no reliable system to balance and predict supply and demand. The field Superintendent said that his company management frowned upon any field demands that could “interfere” with capacity utilization decisions at the fabrication facility. End of discussion. The customer ends up paying – if not in change orders, in delays and unreliability of project completion, with every day of delay keeping them from generating revenue from the new lines and the new water cleaning plant the lines fed.
The effect on material inventory can be seen here:

The operative underlying mental model for project management is essentially “divide and conquer” rather than “collaborate and coordinate”. Spools delivered out of sequence to a central materials lot are moved and resorted multiple times at the risk of delivering the wrong spool to the wrong location and more rework. Fabrication can claim 80% of spools fabricated, but does that equate to 80% of the installation that can be completed?
Because we are not used to designing construction projects as production systems, with an end-to-end flow and measurable throughput rates, we miss seeing the consequences of our choices at the sub-system level on overall project success. In order to smooth production flow, our industry must deploy more automated production management tools that connect fabrication, delivery and installation in real time to establish a reliable flow of resources based on the readiness of the field pulling the whole supply chain.
Finally, here are a couple of non-linear situation examples:
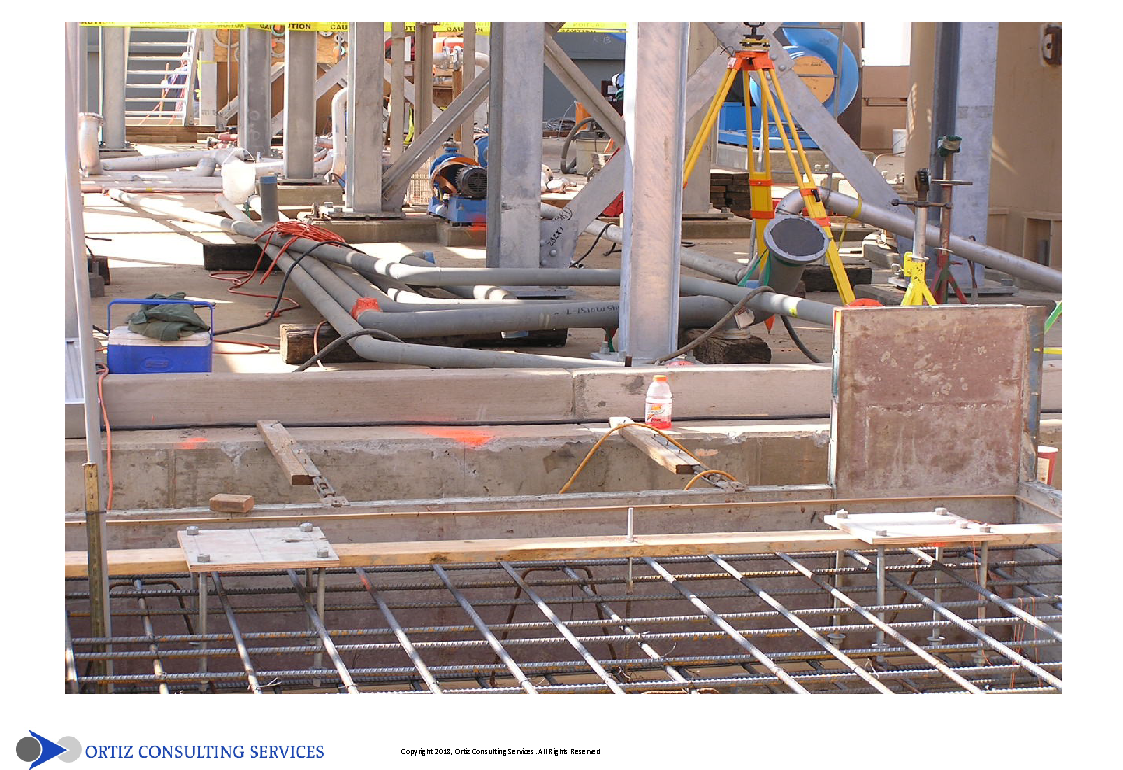
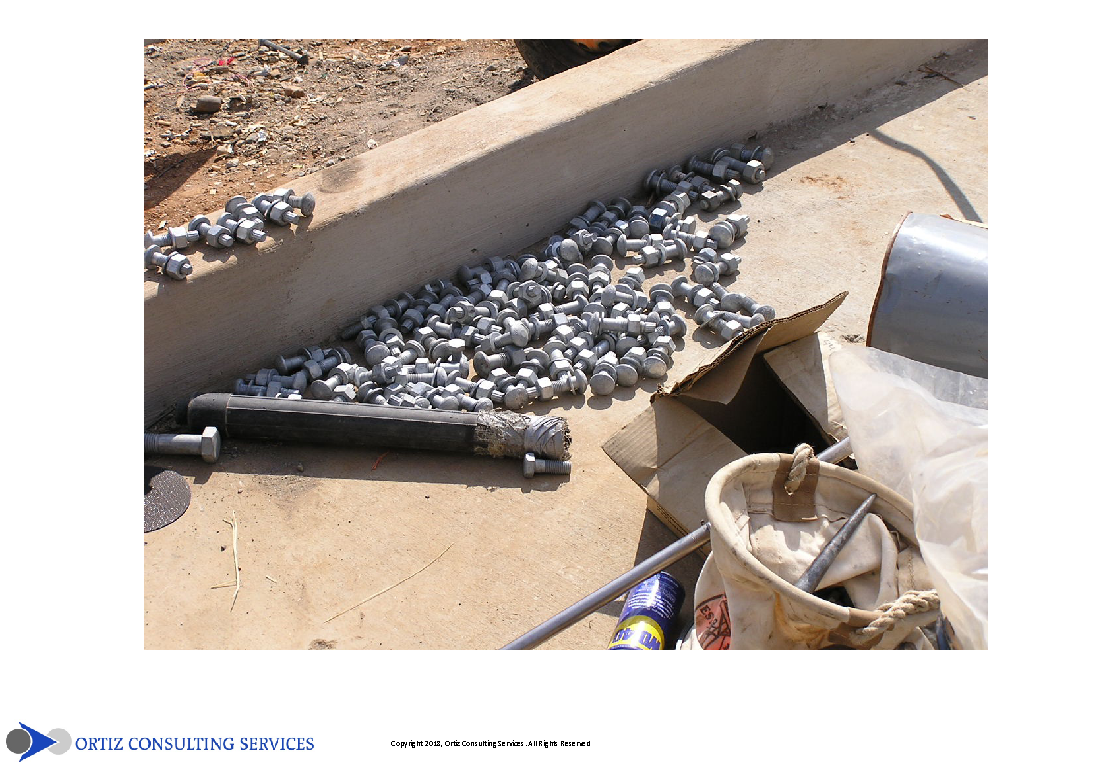
What do you see in these photos? The clutter is obvious. There is excess inventory, work in process, and all sorts of safety hazards inviting the worst sort of “errors” – injuries. Again, the underlying model is to keep resources working on installation, not cleanup, but the installation process is clearly so disorganized that one must doubt whether any “efficiencies” are being realized. These examples cry out for a “5 S” Solution.
As discussed in Post #2, when a Last Planner® Solution is properly executed, the production system creates a multi-week Look-Ahead with increasingly detailed immediate work completion plans. Constraint Analysis allows early identification of missing or incorrect materials and other errors. The goal is to complete 100% of the work that should be done each day as committed. Only about 85-90% of capacity should be committed to the planned tasks, leaving a small buffer that clean and organize, eliminate upcoming constraints and solve problems. The examples above are evidence of a failure to effectively design and manage the production system.
Excess capacity applied to the “5 S’s” (Sorting, Simplifying, Sweeping, Standardizing, and Self-discipline) can create workplace results like these:
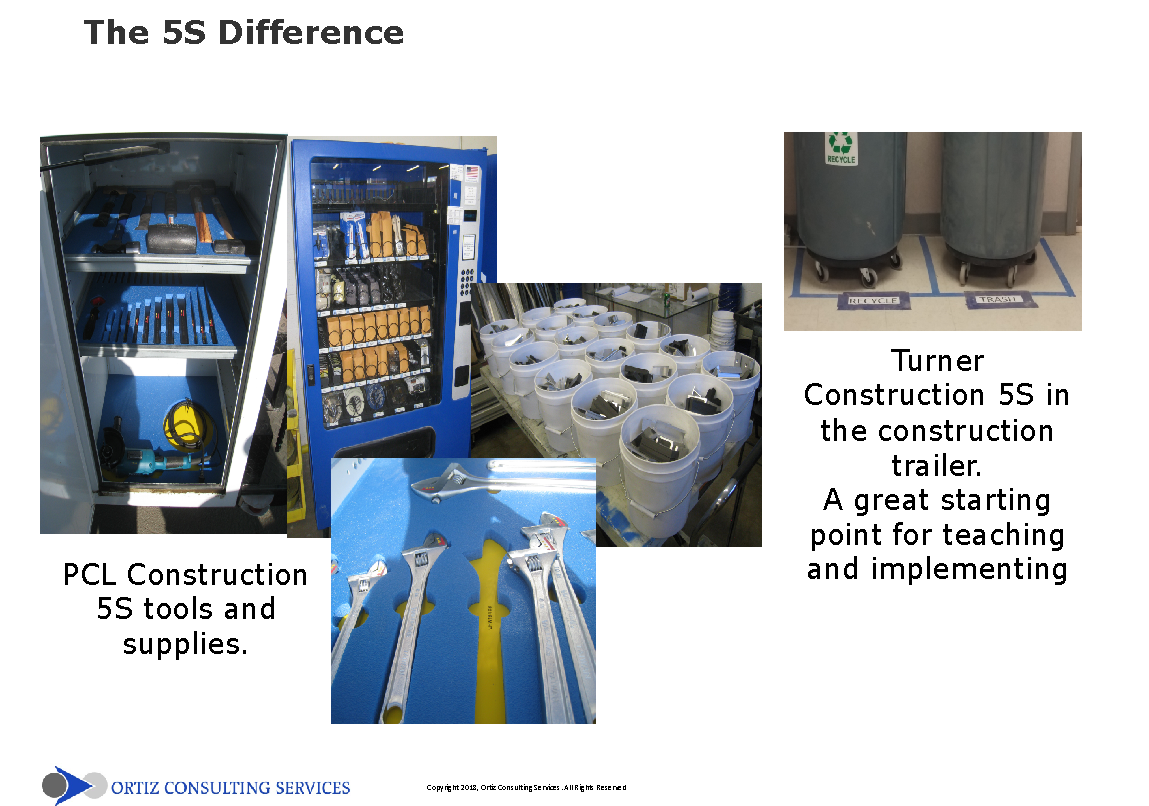
If tools, materials, even office spaces are organized like this and available to work areas, how much more efficient will the work be, as compared with the more cluttered site examples?
As I said in the first post in this series, when we learn to recognize waste in the current system we can find almost unlimited opportunities for improvement – something that adds both meaning and excitement to any job! That excitement provides the energy we need to overcome the inertia of habit and the enormity of needing to rethink the way we do business. The key to adding value and reducing waste is to examine the choices we make, both big and small, and to make better-informed choices based on a more enlightened and informed understanding of work systems.
Now the challenge is yours. How can we design and implement ever-better, smooth-flowing production systems that produce waste-free value exactly when and were needed?
Get your teams together. Take waste walks regularly. Photograph and document what you find. Do root cause analysis and collaborative problems solving – and then… submit your findings and improvements in the chat below.
Let’s keep the discussion and the learning going for everyone’s benefit.